Why Data-Driven Decisions Are the Future of Activity Parks (IAAPA 2025 Insights)
The Wake-Up Call at IAAPA 2025
Walking the floor at IAAPA 2025 in Orlando, one theme dominated conversations: data. Not in the abstract sense — but in the practical, "what should I actually measure?" sense that operators care about.
The attractions industry is at an inflection point. Major players are investing heavily in data infrastructure, while many smaller operators are still running on gut instinct and spreadsheets. The gap is widening, and the operators who embrace data-driven decision making now will have a significant advantage.
Here's what we learned from dozens of conversations with park operators, vendors, and industry consultants.
Why Data Matters More Now
Three converging trends are making data critical:
1. Guest Expectations Have Changed
Today's guests research before they visit. They read reviews, compare prices, and have higher expectations. They've been trained by Netflix, Amazon, and Uber to expect personalized experiences. Parks that understand their guests can deliver those experiences.2. Labor Costs Keep Rising
The days of "just throw more staff at it" are over. Minimum wage increases, staffing shortages, and turnover costs mean you need to optimize labor scheduling based on actual demand patterns — not guesses.3. Competition Is Getting Smarter
Your competitors are investing in better systems. The operators who use data to make faster, better decisions will take market share from those who don't. It's that simple.The Data Most Parks Don't Have (But Should)
Talking to operators, we found a common pattern: they have some data, but they're missing the pieces that would actually help them make better decisions.
What Most Parks Have
- Total revenue and transactions
- Basic visitor counts
- Social media followers
- Google review ratings
What Most Parks Are Missing
Guest Journey Data
- Where do guests come from (acquisition source)?
- How many visits before they become regular?
- What's the path from awareness to booking?
- When do guests stop returning, and why?
Operational Efficiency Data
- Average check-in time per guest
- Capacity utilization by time slot
- Staff-to-guest ratios during peaks
- Session fill rates by day/time
Predictive Data
- Which days will be busy next month?
- What weather triggers cancellation spikes?
- Which promotions actually drive bookings?
- What price point optimizes revenue (not just volume)?
The "Data Maturity" Spectrum
Based on IAAPA conversations, parks generally fall into three categories:
Level 1: Gut Instinct (Most Parks)
- Decisions based on experience and intuition
- Data is scattered across systems (or on paper)
- Reporting is manual and infrequent
- "We've always done it this way"
Level 2: Basic Analytics (Growing Segment)
- Daily/weekly reports on core metrics
- Some integration between booking and POS
- Starting to track acquisition channels
- Making reactive decisions based on data
Level 3: Data-Driven (Rare, Growing Fast)
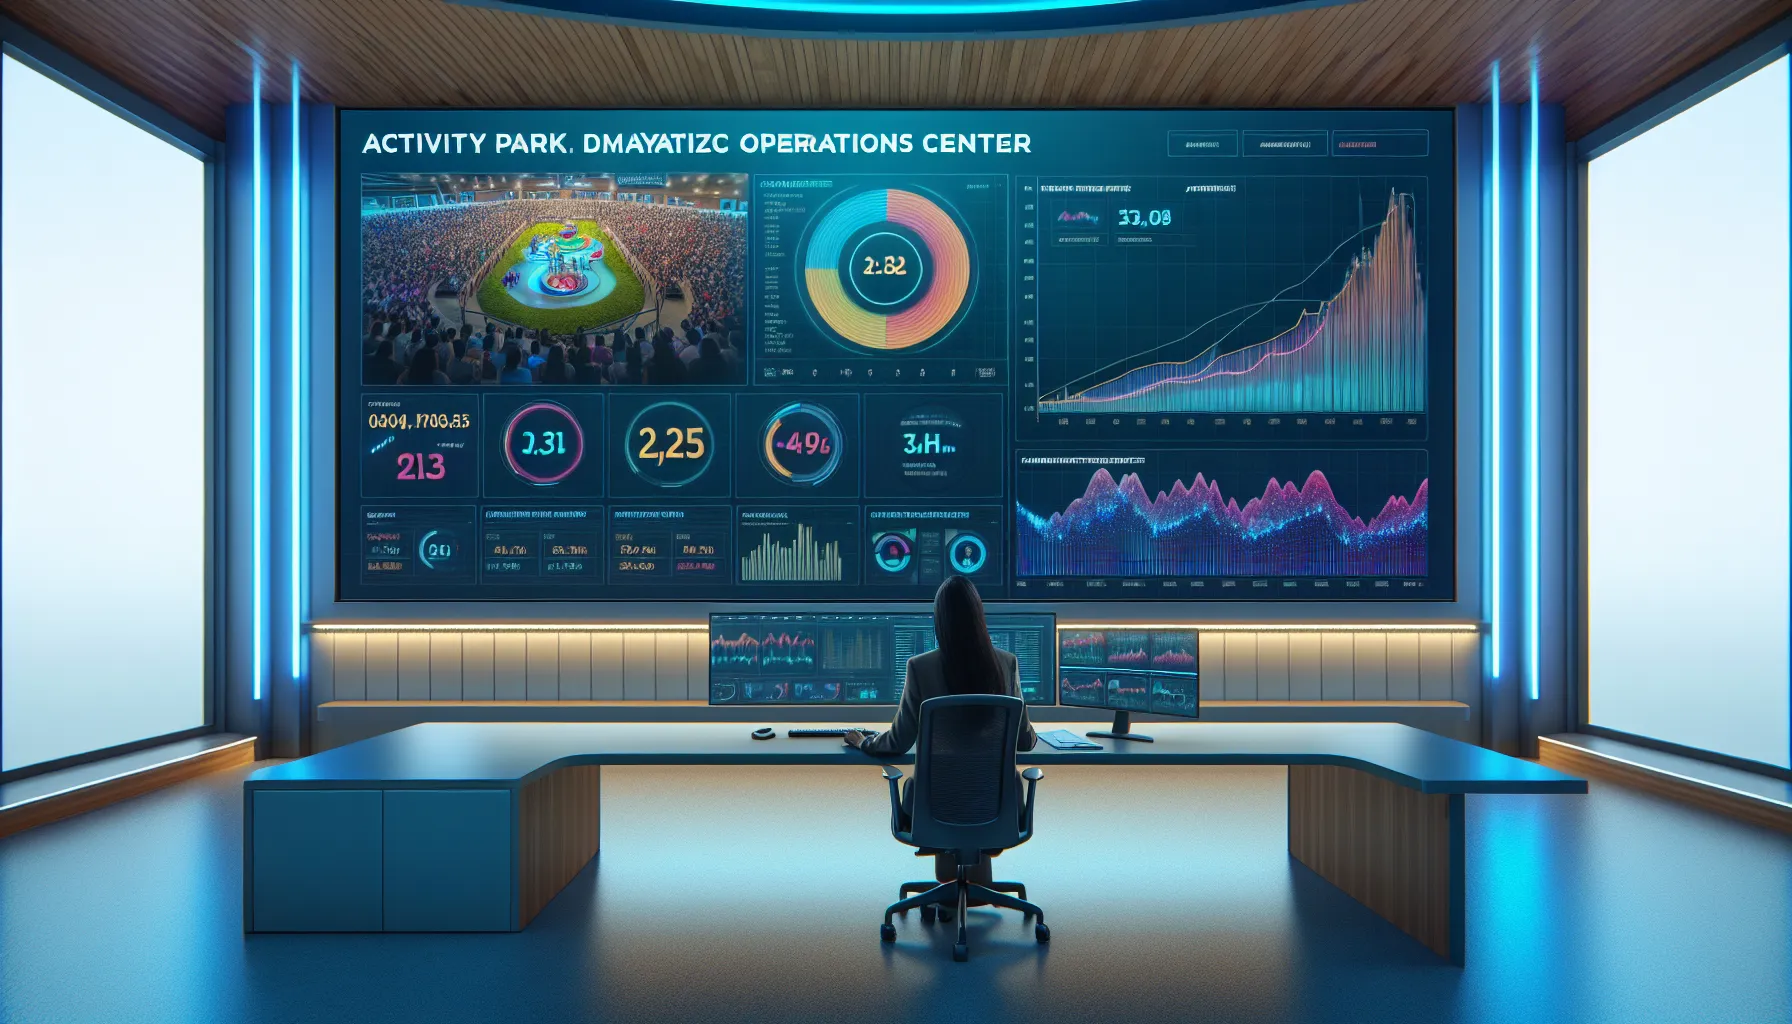
- Real-time dashboards for key metrics
- Automated reporting and alerts
- A/B testing marketing and pricing
- Predictive modeling for staffing and inventory
- Proactive decisions informed by data patterns
Practical Steps to Start Today
You don't need to boil the ocean. Here are concrete steps to move toward data-driven operations:
Step 1: Pick 5 Key Metrics
Don't try to track everything. Choose 5 numbers that matter most for your business:- Revenue per guest — Total revenue ÷ total visitors
- Online booking percentage — Online bookings ÷ total bookings
- Pre-arrival waiver completion — Waivers signed before arrival ÷ total guests
- Capacity utilization — Actual guests ÷ available capacity per session
- Google review rating — Rolling 90-day average
Step 2: Connect Your Systems
The biggest data gap for most parks is disconnected systems:- Booking system knows who booked online
- POS knows who paid at the door
- Waiver system knows who signed
- Marketing system knows who clicked ads
Step 3: Schedule Weekly Data Reviews
Data is useless if nobody looks at it. Block 30 minutes every Monday to review:- What happened last week vs. what you expected?
- What surprised you?
- What will you do differently this week based on the data?
Step 4: Start One A/B Test
You probably have theories about your business that you've never tested:- "Saturday mornings are always busy" — Are they? Which Saturdays?
- "Our email promotions drive bookings" — Do they? How much?
- "Lowering prices would fill more slots" — Would it? By how much?
What the Enterprise Players Are Doing
At IAAPA, we also saw what the large operators are investing in:
Real-Time Capacity Management
Major theme parks are moving beyond static capacity limits. They're using real-time data to:- Adjust pricing based on demand (dynamic pricing)
- Send guests to under-utilized areas via app notifications
- Predict wait times and manage guest expectations
Guest Segmentation
Instead of treating all guests the same, leaders are segmenting:- First-timers vs. returning guests
- Birthday party groups vs. couples
- Local regulars vs. tourists
- High-value vs. price-sensitive
Predictive Staffing
Labor is often 30-40% of operating costs. Leading operators use historical data and weather forecasts to:- Predict demand with high accuracy
- Schedule staff to match expected guest flow
- Reduce overtime while improving guest experience
Common Objections (And How to Overcome Them)
"We're too small for data."
You're not too small — you're too small to waste money on bad decisions. A 10% improvement in capacity utilization or marketing ROI could mean tens of thousands in annual revenue. Even small parks benefit from tracking key metrics."Our staff won't use dashboards."
They will if the dashboards help them do their jobs. The problem is usually that dashboards are designed for executives, not front-line staff. Build views that answer questions staff actually have: "How busy will we be today?" "Which sessions are undersold?""We don't have time."
You're spending time making decisions every day. The question is whether those decisions are informed by data or by guesswork. A 30-minute weekly data review saves hours of fixing bad decisions."Our data is too messy."
Every park's data starts messy. The key is to start with a small, clean dataset (like the 5 metrics above) and expand from there. Perfection is the enemy of progress.The Technology Shift Enabling This
A decade ago, data-driven decisions required expensive BI tools and dedicated analysts. Today, the tools have democratized:
- Integrated platforms (like wakesys) give you unified data out of the box
- Self-service BI (Metabase, Looker Studio) let you build dashboards without developers
- Automation (Zapier, Make) connects systems that don't natively integrate
- AI tools (ChatGPT, Claude) can analyze CSV exports and suggest insights
A Worked Example, Including the Part We Got Wrong (Added August 2026)
Everything above is easier to write than to do, so here is a real one from our own park, mistakes included.
In June we put an in-the-moment upsell into our online booking flow: after a group picks its activity, we offer a second activity at a discount. Two weeks later we had three weekly readings of the attach rate, each higher than the last. We wrote it up and called it a trend.
It was not a trend. Two of those three readings were weeks that had not finished. Once they closed and refunds netted out, the picture changed, and the four full weeks that followed did not go higher. The rate had plateaued at about 31 percent within three weeks and has stayed between 28.7 and 33.5 percent ever since, across 2,175 online bookings.
Three lessons came out of that, and they are the ones we would actually pass on:
- A running week is not a data point. Putting an unfinished week in a table next to closed ones is what made a flat line look like a rising one. It is the single easiest way to fool yourself with your own dashboard.
- The flat number was more useful than the climbing one. A rate that holds within five points across six weeks of peak season is something you can put in a budget. A rate that appears to be climbing is not, because you have no idea where it stops.
- Look at the second variable. The attach rate went flat, but revenue per upgrading booking rose from $34.43 in June to $43.79 in August with no price change, because party sizes grew and groups upgrade as a unit. If we had only tracked the headline rate we would have concluded nothing was happening.
A Vision for the Future
Imagine running your park in 5 years:
- You wake up to an automated report: "Today will be 23% busier than typical due to school holiday. Consider adding one additional lifeguard at 11 AM."
- Your pricing adjusts automatically based on demand, optimizing revenue without constant manual changes
- Marketing campaigns trigger based on guest behavior: first-time visitors get one sequence, lapsed customers get another
- Your staff app shows real-time wait times and suggests where help is needed
- At the end of the month, you see exactly which marketing channels drove bookings and at what ROI
Getting Started
The attractions industry is moving toward data-driven operations. The parks that embrace this shift will make better decisions, operate more efficiently, and deliver better guest experiences.
You don't need to transform overnight. Start with 5 key metrics. Connect your systems. Schedule a weekly review. Run one experiment.
The compound effect of small improvements is enormous. The best time to start was five years ago. The second-best time is now.
wakesys provides integrated booking, waivers, and POS with unified reporting — giving you the data foundation to make smarter decisions. Book a demo to see how it works.
Updated 8 August 2026: added a worked example from our own 2026 season, including the mistake of reading three data points as a trend when two of the weeks had not finished. Originally published 18 November 2025.

Chris Hilbert
Founder, wakesys
Park operator and software founder. Running Charleston Aqua Park and building wakesys to help activity centers succeed.